
Data Modeling for the Agentic Era: Semantics, Speed, and Stewardship


In data analytics, we’re facing a paradox. AI agents can theoretically analyze anything, but without the right foundations, they’re as likely to hallucinate a metric as to calculate it correctly. They can write SQL in seconds, but will it answer the right business question? They promise autonomous insights, but at what cost to trust and accuracy?
These days, everyone is embedding AI chat in their product. But to what end? Does it actually help, or would users rather turn to tools like Claude Code when they need real work done? The real questions are: how can we model our data for agents to reliably consume, and how can we use agents to develop better data models?
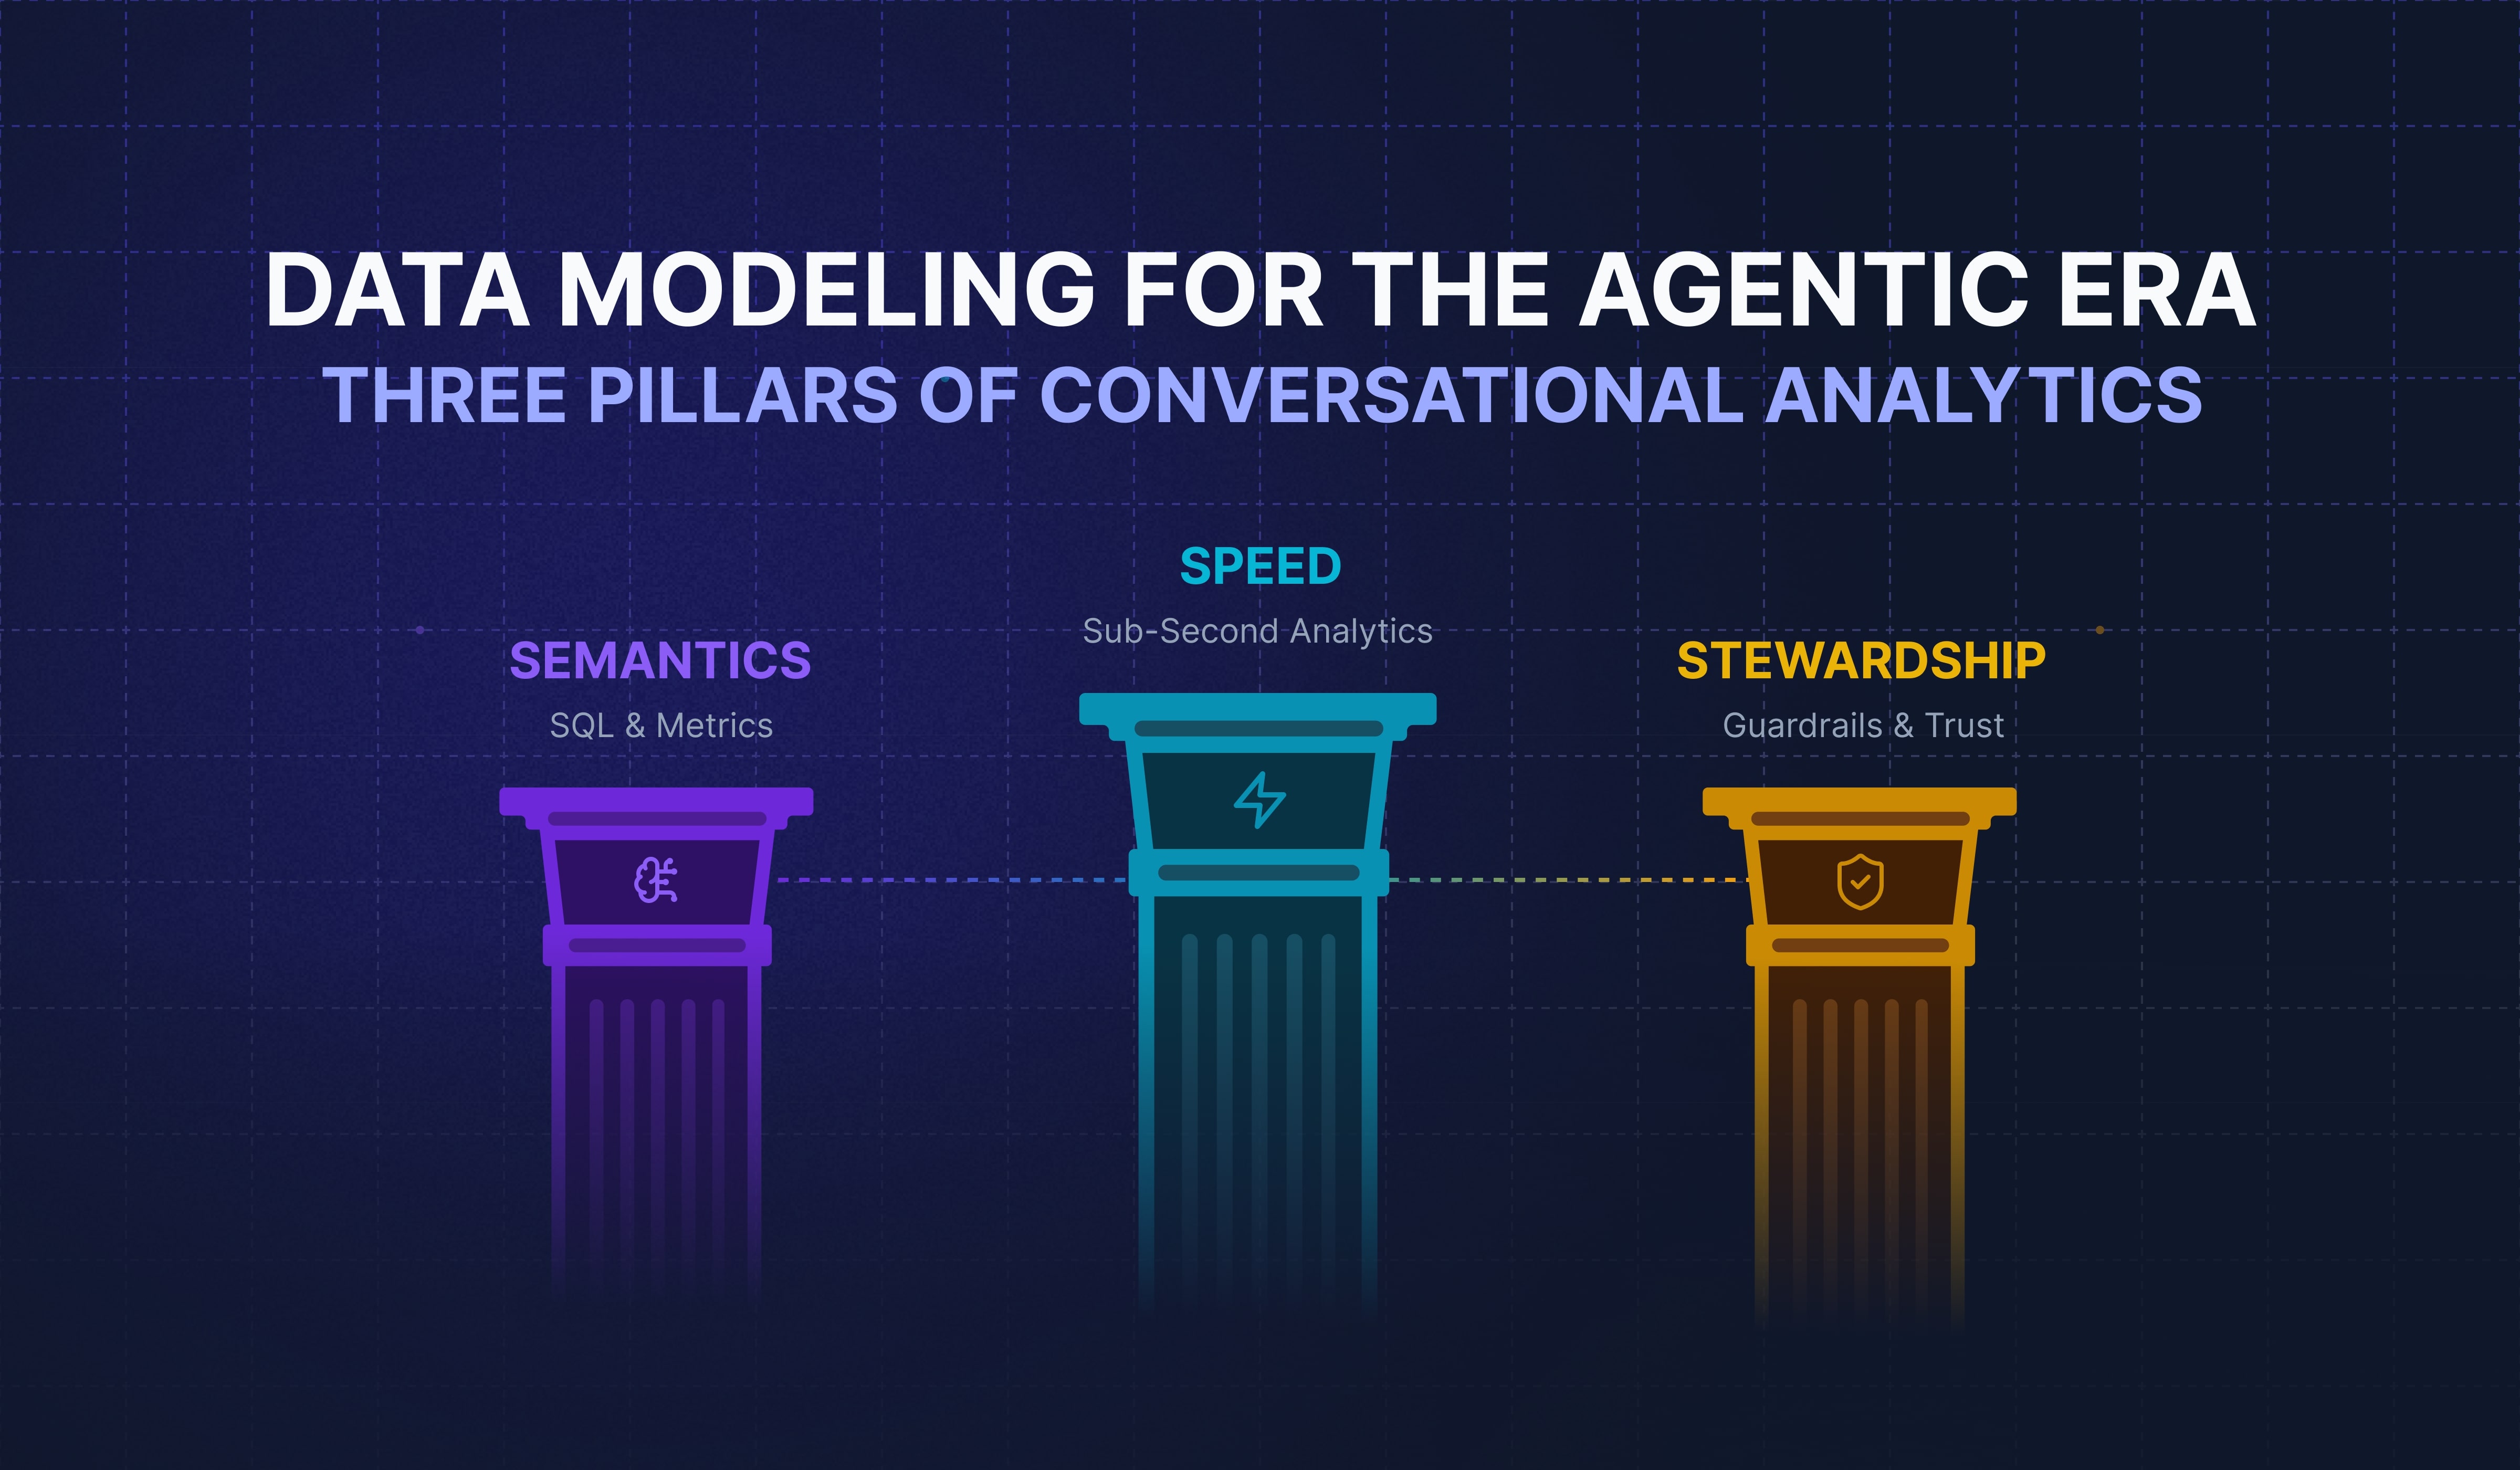
After spending the last year exploring where LLMs have genuine leverage in analytics (see my writing on GenBI and Self-Serve BI), I’ve identified three essential pillars that make agentic data modeling actually work: semantics as the shared language both humans and AI need to understand metrics, speed through sub-second analytics that lets you verify numbers before they become decisions, and stewardship with guardrails that guide without constraining. The TL;DR? AI needs structure to understand, humans need speed to verify, and both need boundaries to stay productive.
In this forward-looking article, we investigate how to build data stacks where AI augments rather than overtakes your analytics. The future of data modeling isn’t humans or agents—it’s humans with agents, each doing what they do best.
The Three Pillars for Agent-Based Modeling
So why are these three pillars—semantics, speed, and stewardship—important for data modeling? If we look at how metrics are structured and see how SQL with its metrics works, we can then understand how LLMs can help us model our data stack to answer the questions we want to understand as business owners. With the right guardrails in place, agentic modeling can be a big success.
Let’s start with the foundation of agentic workflows in data modeling, condensed into the three pillars below.
1. Semantics: Understanding and Context for Human and AI
Semantics and their metrics (layer) provide an open, structured, and explorable context for LLMs to iteratively learn from. One-Big-Table (OBT), OLAP-style tables with business KPIs on top provide a curated target for agents to operate on, with immediate responses for the model to iterate on.
While semantics and metrics are key, the language is often SQL. It’s the language of data that AI agents understand better than natural language (English). It’s more accurate and more detailed, avoiding subtle misunderstandings (end of hour? end of day? or until now?). Instead of writing a custom query language, we can use the well-established, declarative language of data. Agents should be able to query existing metrics and create new metrics on the fly, using SQL expressions (aka Metrics SQL; more on this later).
2. Speed: Sub-Second Iterations
Agents embedded in applications must be quick. Latency kills productivity and idea iteration. Especially in BI or data work, fast elaboration allows users to quickly iterate and verify the outcome numbers. The longer we wait, the less likely we are to thoroughly battle-test the numbers. Sub-second response times are needed to stay focused. Modeling for speed is critical. Think of real-time analytics databases such as ClickHouse or DuckDB.
3. Stewardship: Guardrails and Human Judgment
The last pillar is adding constraints. To make AI useful and not introduce errors, we need a way of collaborating with the large language model and telling it what to do and what not to do. This is called data stewardship. This is a well-defined term from master data management times, and we can reuse this knowledge for agentic workflows as well.
We can define some do’s and don’ts with an ai_instructions.md that tells the model to never accept a data type without verifying with Model Context Protocol (MCP), to always check the current date so that it doesn’t think it’s back two years when the model was trained, not to use PII data, and so forth. More on this in the demo chapter.
The second part of stewardship is to involve the human in the loop. With the speed described above, the human can verify hypotheses instantly, as the return of the metrics is instant. The human knows if the number is marginally correct or an order of magnitude off. Or in the best cases, we know the number very precisely.
Why Stewardship? What Does It Mean?
Before we continue, a word on data stewardship: speed with real-time analytics databases is quite clear and I’ve written extensively about it, and we’ll discuss semantics and their metrics and the connection to agentic modeling later in great detail. Stewardship is something that is new in the context of AI and agentic workflows. Let’s define what we mean by that.
With all the liberty that AI gets—such as access to databases, all KPIs, and sensitive context through prompts—comes more risk. Besides the risk of failure, hallucination, poor data quality, leaks, privacy violations, regulatory breaches, etc., the models can also go off the rails without guardrails. We need more robust governance that is tightly integrated into the workflow.
If we look at a study by Barc, they say that 78% of executives say we have guardrails in place, but at the same time 79% do not address it properly—meaning most executives are overly confident:
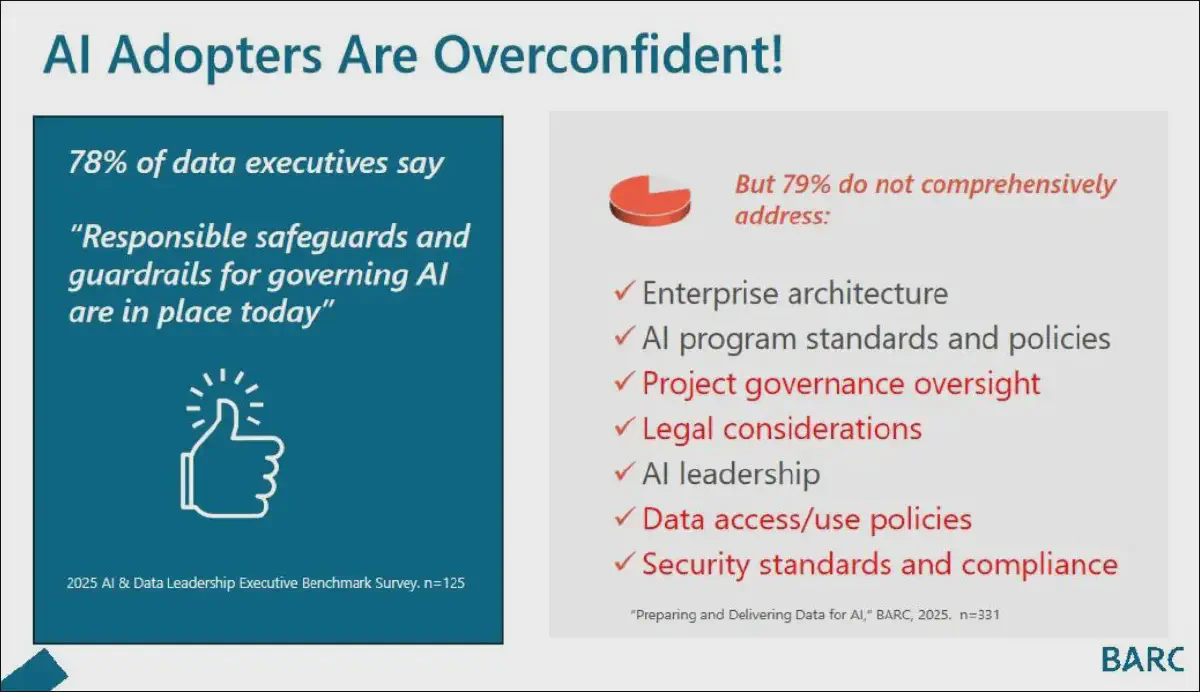
I believe we’re still very early and surveys might not be highly accurate yet. Nevertheless, it’s clear that we need constraints and control mechanisms. That’s where stewardship comes in and helps significantly. We define the boundaries for the model.
With the growing intelligence of LLMs and AI, instead of needing fewer humans, we need more. Similar to radiologists with machine learning approaches that scan hundreds of thousands of images, we now need more radiologists as there are many more images to verify and confirm whether the ML models have correctly identified suspected cancer. That’s called Jevons’s Paradox.
The same applies to data stewards. It becomes increasingly important over time. We need more humans, not fewer, integrated into the workflow of agentic business intelligence and analytics sense-making.
How Do We Integrate Stewardship Seamlessly? And How Does It Look in Agentic Modeling?
But how can we integrate stewardship? What’s the interface? How can we steward the process and the data model creation without adding much more work, making it as lean as possible? Do we need guardrails during the consumption of analytics and the generation of new ones?
We can prepare an introduction prompt with things the model should do and things it should not do. We can specify which API to use, which MCP if one is available. We can instruct it to verify with an additional prompt if things are unclear instead of just assuming.
For example, in Rill this can be easily added as ai_instructions to your normal model—either on a project level in rill.yaml or inside the metrics such as auction_metrics.yaml, which are considered extra instructions for the AI agents such as the Rill MCP Server. Here is an example of how this looks:
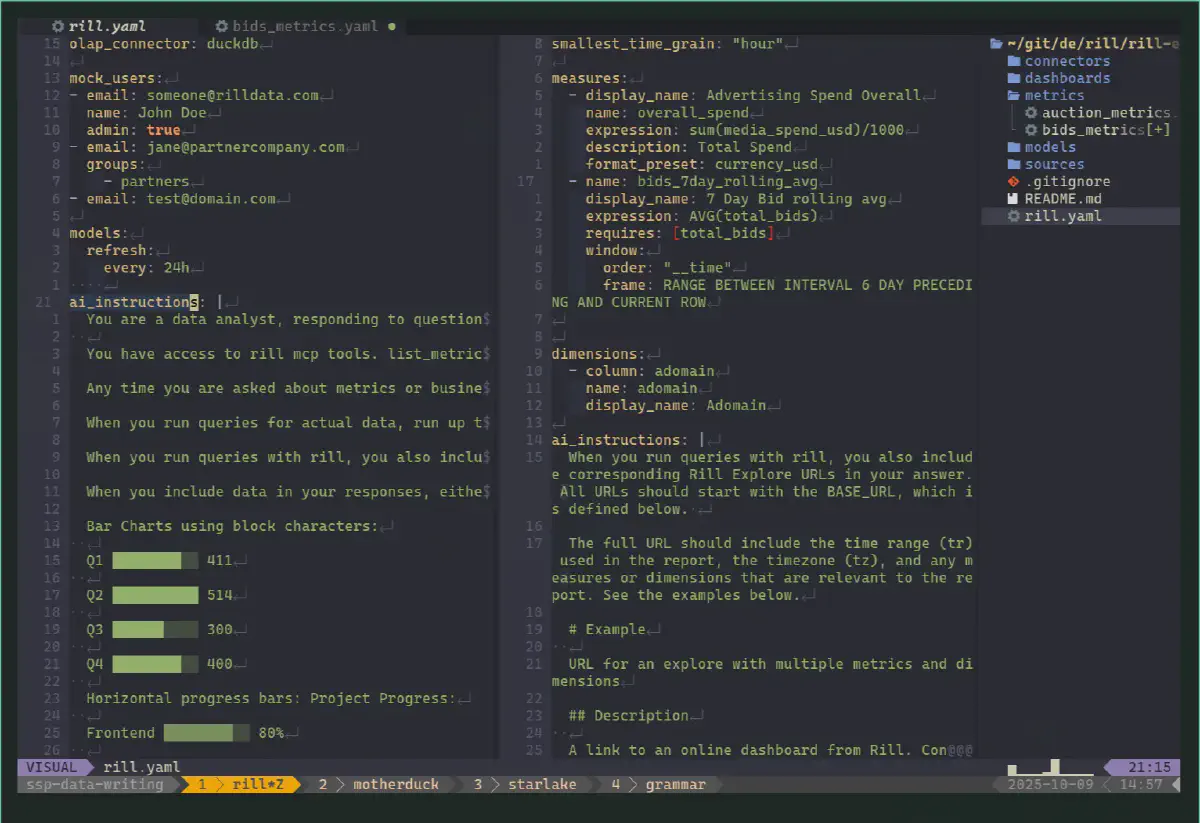
Good stewardship needs to be configurable and customizable to suit the project. It should exist at different levels—such as at a low level on a dashboard or metrics level, or across the analytics platform—not only at the semantics level.
Semantics: Metrics Modeling for Agentic Workflows
Exploring and comparing the overlaps between “human” and agentic modeling will help us better understand how an agent can benefit from modeling. This also works through semantics, which are the metrics and definitions we set in place to run our business. These are essential for a functioning agentic modeling workflow.
The Evolution of Data Modeling and Metrics
If we take a step back and look at semantics and how we model our business metrics (measures and dimensions) with SQL and YAML, we can better understand how to integrate stewardship with semantics and speed for an improved agentic workflow.
Looking back two decades, we see that we have been using SQL as a query language for a very long time, especially in combination with window functions such as OVER( PARTITION BY ...) and other advanced features that are often used for fast query responses with OLAP cubes. Semantics were always part of that, even more prominently within the BI tools themselves.
The history over time shows the trends toward a new evolution of LLM-supported modeling techniques. Each era brought critical capabilities: the Classic DWH Era established dimensional modeling fundamentals that are still used heavily in analytics today. The Modern BI Era made semantics portable and version-controlled through YAML, and now the Agentic Era is extending SQL itself to bridge human and AI understanding:
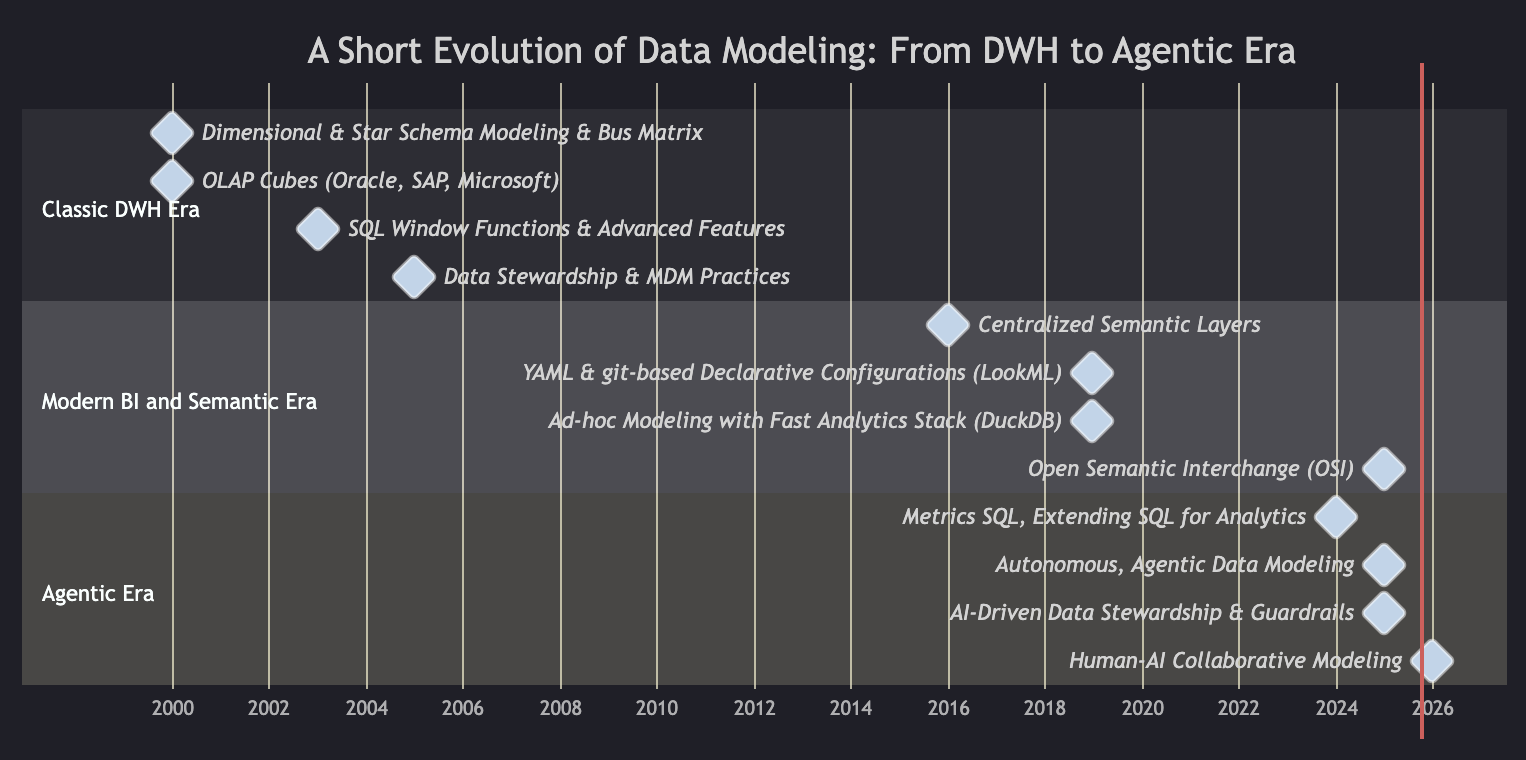
A brief overview of the data modeling evolution. Not meant to be complete, but to focus on the major part related to this article.
More generally, we can say that there are different modeling approaches that go from conceptual to logical to physical data models.

A simple flow from conceptual to the physical data model.
Going one step deeper, we have different data architecture modeling patterns such as the Classical Architecture of Data Warehouse or Medallion Architecture, or streaming or batch approaches. We have grain that we need to model, the level of normalization we need, and we have data modeling techniques that we can use to model once the data is loaded into our system, such as Facts and Dimensions following The Data Warehouse Toolkit principles by Ralph Kimball, or Data Vault, Bitemporal Modeling, or even newer techniques such as Star Schema or Entity-Centric Data Modeling (ECM).
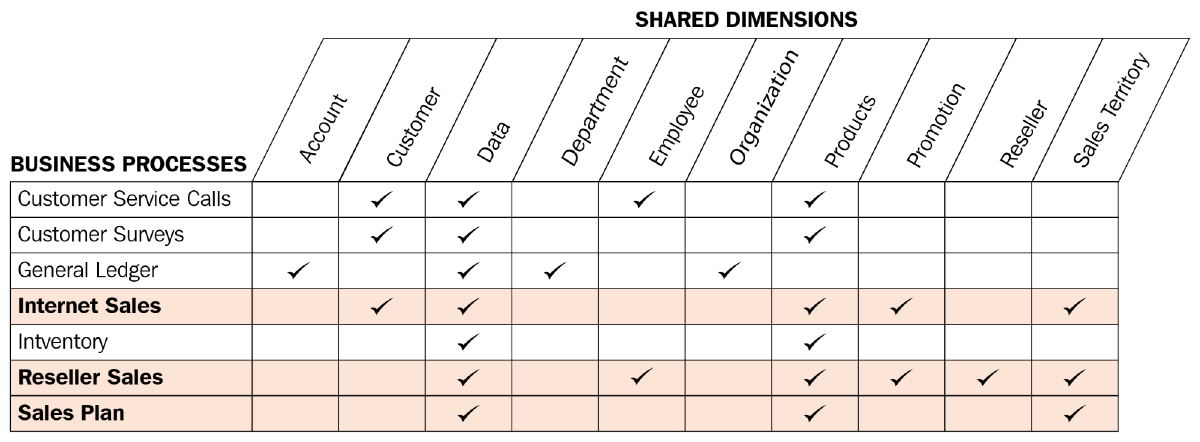
A Bus Matrix is used to define which dimensions can be used with which fact table (measure). In it, we have calculated measures, which are our numerical insights such as revenue, profit, etc.
There’s a lot, but knowing these 101 principles of data modeling and their data architecture implications will help us guide and prompt agents in the right direction. There’s no right or wrong among the above choices in general, only when applied to certain use cases and your specific organization.
In this article, we won’t go into more of these details, but we can highlight that the fundamentals of data modeling are needed to properly use them for agentic workflows.
SQL is declarative
This helps us with integration into an agentic workflow as the models and agents can integrate seamlessly into declarative SQL configs (see a YAML example further down). Every agent can not only gain insight and context about the current data project, but can also extend it easily.
The YAML Revolution
Recently, we have also experienced a YAML revolution beyond just using SQL. Most YAML configurations in metrics and semantic layers still provide SQL blocks, imitating the SQL structure with arguments such as WHERE, COLUMNS, dimensions, or a straight sql file itself.
Here’s an example of the dbt semantic layer definition language:
semantic_models:
  - name: the_name_of_the_semantic_model ## Required
    description: same as always ## Optional
    model: ref('some_model') ## Required
    defaults: ## Required
      agg_time_dimension: dimension_name ## Required if the model contains measures
    entities: ## Required
      - see more information in entities
    measures: ## Optional
      - see more information in the measures section
    dimensions: ## Required
      - see more information in the dimensions section
    primary_entity: >-
      if the semantic model has no primary entity, then this property is required. #Optional if a primary entity exists, otherwise Required
So what has changed between 20 years ago and today? Mainly, the core semantics and metrics of BI—and therefore of the business—are no longer hidden in obstructive XML files merged with lots of graphical references or other information that is irrelevant to the business user.
Modern BI tools and metrics layers store the key metrics, extracted to their core value—the business metrics—in a lean format usually using YAML. Therefore, we have minimized it to the essentials. We can version it, collaborate on it, and can now start using it to automate it, using it as context for AI models and agentic workflows.
In essence, the semantics are extracted in a way that prepares them for an agentic future.
Metrics: The Building Blocks of Data Modeling
So what are metrics? How do agents and metrics work together, and what is a metric exactly?
Metrics as part of BI show the company’s key insights in a simple, fast-to-read report or dashboard. These are highly aggregated and updated monthly, daily, or at similar intervals for the sole purpose of understanding the past for future decisions. A formal definition of a metric can be as follows:
A metric or measure is a context-specific expression that answers business-specific questions. A metric evaluates data across various dimensions and typically represents a key business indicator or performance measure, without requiring explicit SQL joins or aggregations for each calculation.
Again, metrics are essentially how people will interact with your data model. Questions like how you think facts and dimensions are connected, which dimensions can filter a measure, at what granularity (level: daily, hourly, or weekly?), and whether you can filter by product or if that represents a many-to-many relationship must be answered.
Metrics, or calculated measures, are expressed in a metrics layer; they’re the units we work with and combine with dimensions across cubes or models. These are fundamental to understanding effective modeling. Especially in real-time analytics, everything is defined by metrics.
Metrics help us understand and model data in a business-oriented way. We can’t define what we want to display in business intelligence tools using plain English; we need clear definitions with their rules and constraints so that everyone knows what others are discussing.
But how are metrics expressed? How are they defined in a BI tool or a semantic layer?
What about the newly formed “Open Semantic Interchange (OSI)” by Snowflake?
It’s an initiative by Snowflake that states that interoperability and open standards are essential to unlocking AI with data and that OSI is a collaborative effort to address the lack of a common semantic standard, enabling a more connected, open ecosystem. The OSI initiative aims to standardize semantic model exchange through a vendor-agnostic specification and a YAML-based OSI model plus read/write mapping modules that will be part of the Apache open-source project. Hard to say how that plays out. Continue the discussion on Reddit
Metrics SQL: A SQL-Based Semantic Layer
The easiest way—and how it’s been done in BI tools for ages—is with SQL. As with the YAML revolution mentioned above, we’ve seen many SQL expressions or SQL expression split into different properties.
SQL has its advantages over plain YAML as it’s very precise about what a user wants; there is no misunderstanding what’s needed. But at the same time, it can become very verbose without variables or other more advanced features. That’s mainly why YAML is so popular; it’s easy to define declaratively and build on top of each definition without duplication.
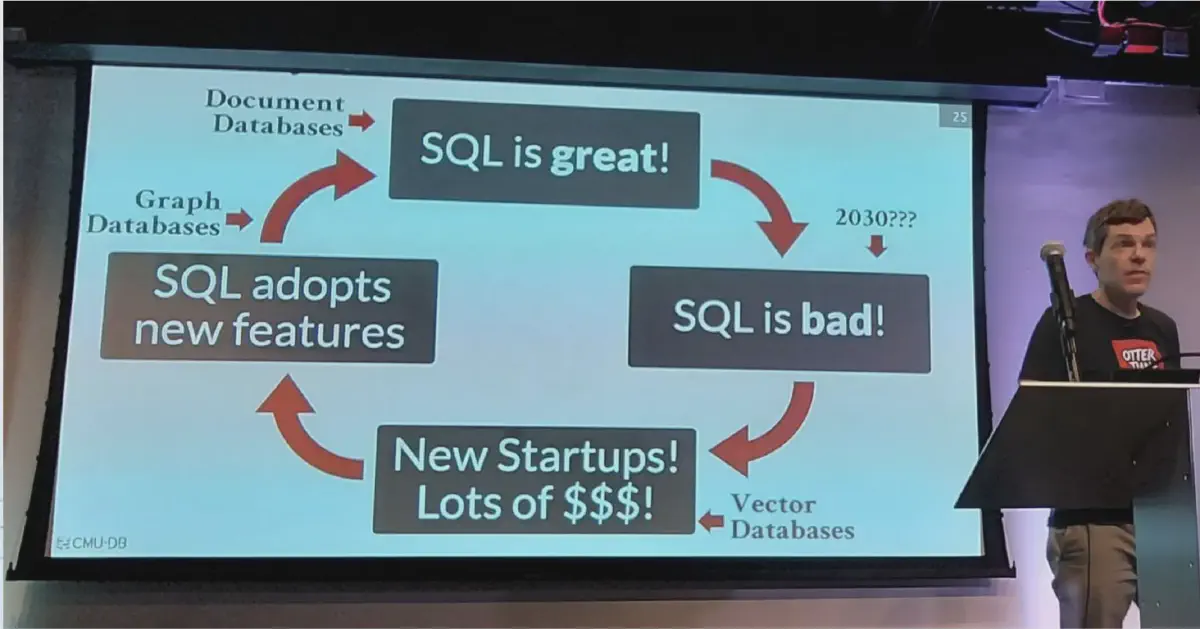
But what if we could use SQL and extend it? Like a newer version of metrics with advanced capabilities. It’s called Metrics SQL, the next version of plain measures in BI tools that is also different from semantic layer definitions. There have been many cycles of SQL being declared dead, only to discover that SQL is not that bad. That’s why Metrics SQL goes all in on SQL.
What is “Metrics SQL”?
So what is “Metrics SQL” then? And how does it relate to other terms like LookML or semantic layers?
Metrics SQL is a specialized SQL dialect designed exclusively for querying data from Metrics Views (where you define your measures and dimensions). Metrics SQL can be seen as a semantic layer that leans fully on SQL and its capabilities—think of it as extending SQL for analytics (more on this in the next chapter).
Metrics SQL transforms queries that reference dimensions and measures within a metrics view into their corresponding database columns or expressions. This transformation is based on the mappings defined in a metrics view YAML configuration, enabling reuse of dimension or measure definitions. Additionally, any security policies defined in the metrics view are also inherited.
To better understand, let’s look at an example of a Metrics SQL definition that Rill introduces, which can look like this:
type: metrics_view
title: New York Transit Metrics
model: nyc_trips_model2
timeseries: request_datetime

dimensions:
  - name: pickup_zone
    display_name: Pickup Zone
    expression: UPPER(pickup_zone)
  - name: dropoff_zone
    display_name: Dropoff Zone
    column: dropoff_zone

measures:
  - name: total_trips_measure
    display_name: Total Trips
    expression: COUNT(*)
    description: Total number of trips recorded in the dataset.
    format_preset: humanize
  - name: average_trip_miles_measure
    display_name: Average Trip Miles
    expression: AVG(trip_miles)
    description: Average distance covered per trip in miles.
Example: Metrics View configuration as a Metrics SQL Query | from Metrics SQL
To query this view in a Rill project, a user might write a Metrics SQL query like:
SELECT pickup_zone, dropoff_borough, total_trips_measure FROM metrics_view
This Metrics SQL is internally translated to a standard SQL query as follows:
SELECT pickup.zone AS pickup_zone,
    UPPER(dropoff.borough) AS dropoff_borough,
    COUNT(*) AS total_trips_measure
FROM nyc_trips trip
JOIN zones pickup ON (trip.PULocationID = pickup.LocationID)
JOIN zones dropoff ON (trip.DOLocationID = dropoff.LocationID)
GROUP BY pickup.zone, UPPER(dropoff.borough)
Expression instead of LEFT JOIN
With Metrics SQL you can also add a traditional LEFT JOIN with a single line, using lookups with maps in DuckDB or ClickHouse and alike. E.g. resolving user names of an order based on user tables, joined on email:- expression: (SELECT map(list(email), list(user_name)) FROM users_dataset)[email]
This approach creates an in-memory mapping that can be referenced without using a JOIN in SQL.
Advantages of Metrics SQL
So what’s the advantage over normal SQL or YAML definitions? Here are the key benefits:
- Eliminates Redundancy and Verbosity: Metrics SQL references predefined dimensions and measures directly rather than redefining their logic in every query. Even if a dimension represents 1,000 lines of complex logic, you reference it by name, dramatically simplifying queries.
- Compositional Building Blocks Approach: Metrics SQL uses a single FROM clause referencing a metrics view instead of requiring subqueries. This creates a powerful compositional model where complex business logic is encapsulated once and reused everywhere. Each metrics view becomes a reliable building block that agents (or analysts) can query without understanding the underlying complexity.
- Built-in Security and Governance: Any security policies defined in the metrics view are automatically inherited by Metrics SQL queries. Stewardship rules and access controls are enforced at the semantic layer rather than needing reimplementation in every query.
- Precision for Date/Time Logic: Metrics SQL provides more defined and precise date handling, avoiding ambiguities that plague natural language queries (e.g., “does end of day include today’s partial data?”).
- Cross-Dimensional Calculations: Metrics SQL enables complex analytical patterns like period-over-period comparisons, percent-of-total, and non-additive measures without writing repetitive SQL logic—the semantic layer handles the complexity.
- Optimized for AI Agents: SQL is the language of data that AI agents understand better than natural language, being more accurate and detailed to avoid subtle misunderstandings. Since Metrics SQL is declarative and references well-defined semantic concepts, agents can query existing metrics reliably, create new metrics on the fly, and understand the data model through the metrics view schema.
Metrics SQL combines the best of all worlds: SQL’s precision and expressiveness (exact semantics, no ambiguity), YAML’s reusability and abstraction (define once, reference everywhere), and API capabilities (generate OpenAPI specs automatically for integration).
Why does this matter for agentic workflows?
With the three pillars of semantics, speed, and stewardship, Metrics SQL enables agents to operate on curated targets with immediate responses for iteration. The semantic definitions in metrics views provide the structured context agents need, while the SQL interface gives them a familiar, precise language to express queries without introducing hallucinations or ambiguity.
Metrics SQL is extending SQL for the semantic layer era—creating a higher-level SQL dialect that operates on business concepts rather than raw database columns, making it the ideal interface for both humans and AI agents.
Current Limitations
Metrics SQL is specifically designed for querying metrics views and may not support all features found in standard SQL. Its primary focus is on providing an efficient and easy way to extract data within the constraints of metrics view configurations.
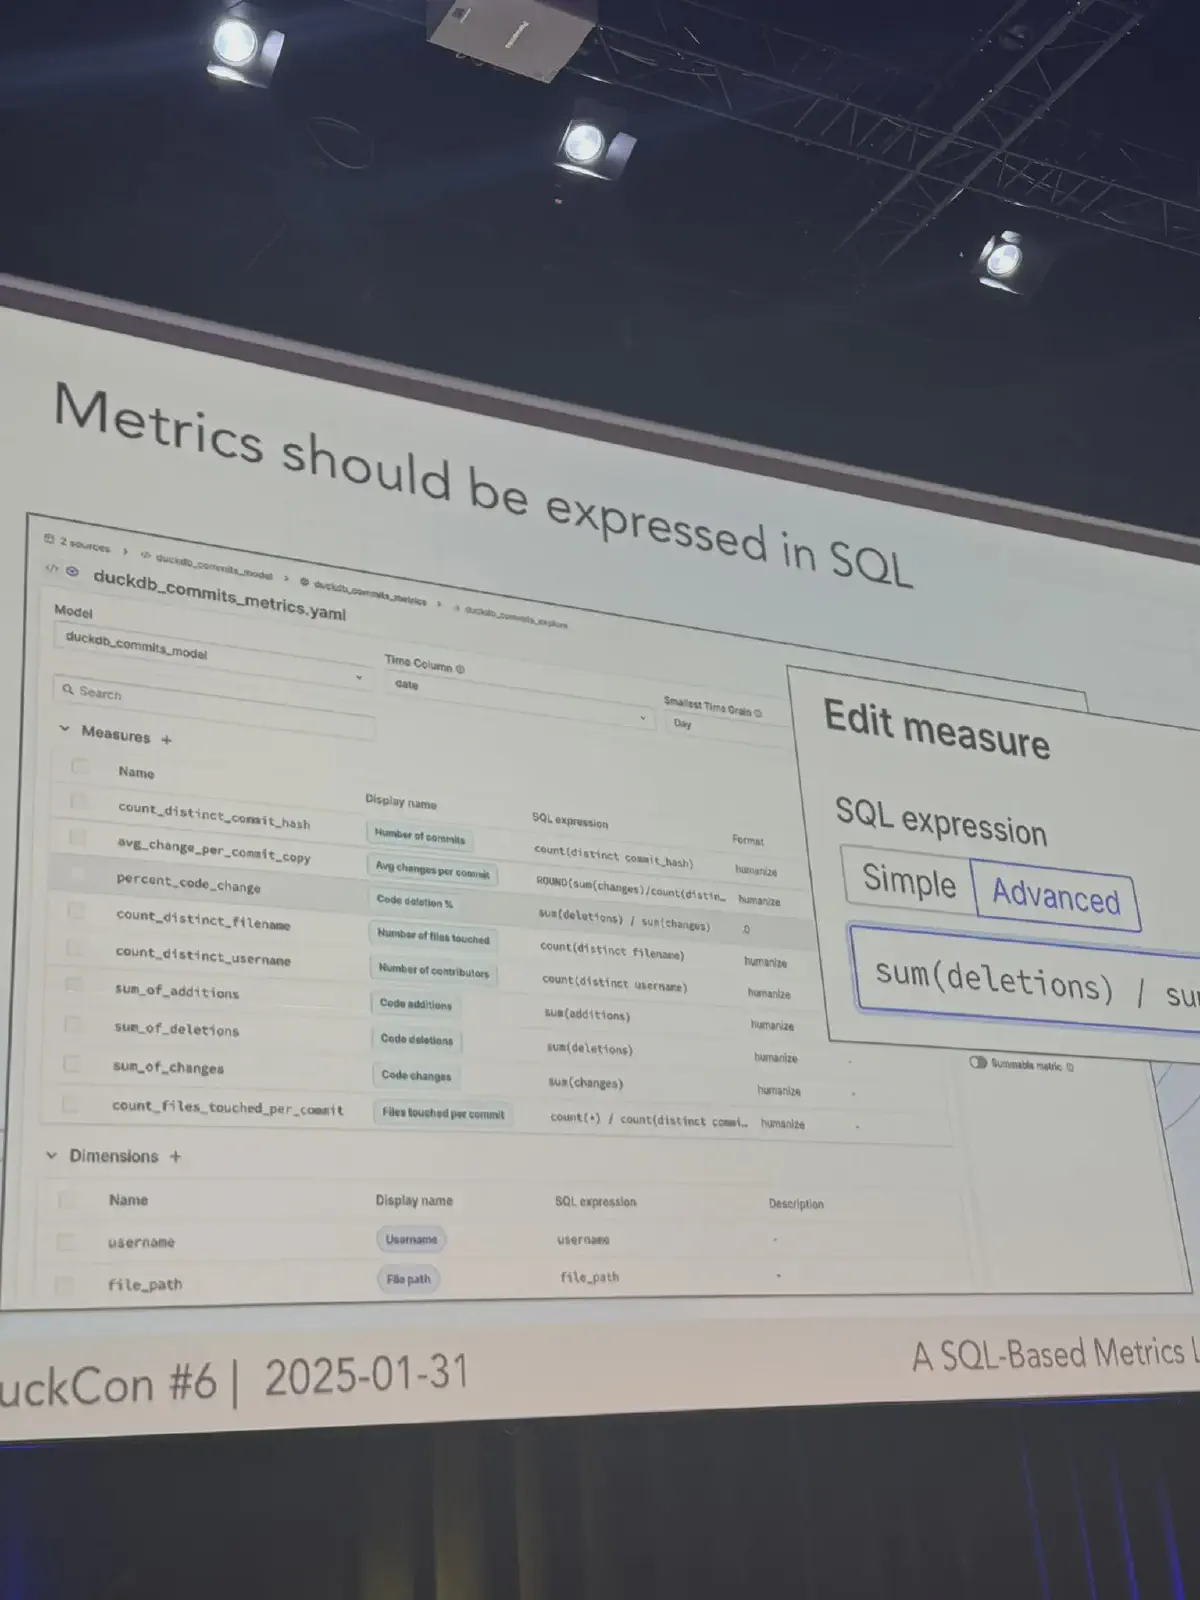
Another example is Mike Driscoll, who says in Introducing a SQL-based metrics layer powered by DuckDB that “Metrics should be expressed in SQL”.
Demo: Agentic Modeling with Stewardship in Mind (plus Semantics and Speed)
But let’s see Metrics SQL in action with agentic data modeling. This demo uses Rill to demonstrate the concepts and principles of semantics, speed, and, most importantly, stewardship.
The key is having a semantic layer—or metrics model—with clear definitions, fast query responses with DuckDB connected to S3 files, and appropriate guardrails. Here’s a short example of how this could look.
GitHub Repo
Everything in this demo can be found on GitHub on this repository: rill-nyc-taxi: Rill demo project showing an interactive, exploratory dashboard of NYC Taxi and Limousine trip record data.
Adding Guiding AI Instructions
The stewardship could be as simple as this ai_prompt. This prompt would work well for agentic data modeling and guardrail a large language model for our benefit:
You are a data analyst, responding to questions from business users with precision, clarity, and concision.

- never return data that does not come from a physical table
- never use columns with sensitive PII data
- If a relative date or time is involved, always verify with the user if the assumed date is correct
- if it's more than 2 MB, prompt the user for more filters
- avoid `select *`
- You have access to Rill-MCP-Server. Use the below functions any time you are asked about metrics or business data to verify tables and columns, query small data to explore data and get more context—e.g. what dimensions, measures or time ranges are available:
	- `list_metrics` enables you to check what metrics are available
	- `get_metrics_view` gets the list of measures and dimensions for a specific metrics view
	- `query_metrics_view_time_rangechecks` what time ranges of data are available for a metrics view
	- `query_metrics_view` will run queries against those metrics views and return the actual data.
  - help the data analyst to find insights from the data.
	  - For example, when you run queries for actual data, run up to three queries in a row, and then provide the user with a summary, any insights you can see in the data and provide results to the analyst
- include data in your responses, either from tool use or using your own analysis capabilities, but do **not build web pages or React apps**. For visualizing data, you can use text-based techniques for data visualization:
	- Bar Charts using block characters: Q1 ████████░░ 411 \n Q2 ██████████ 514 etc.
	- Horizontal progress bars: Project Progress: Frontend ▓▓▓▓▓▓▓▓░░ 80% \n Backend ▓▓▓▓▓▓░░░░ 60% etc.
	- Using different block densities: Trends: Jan ▁▂▃▄▅▆▇█ High \n Feb ▁▂▃▄▅░░░ Medium etc.
	- Sparklines with Unicode Basic sparklines:  Stock prices: ▁▂▃▅▂▇▆▃▅▇ \n Website traffic: ▁▁▂▃▅▄▆▇▆▅▄▂▁ etc.
	- Trend indicators:  AAPL ▲ +2.3% \n GOOG ▼ -1.2% etc
	- Simple trend arrows: Sales ↗️ (+15%) Costs ↘️ (-8%) Profit ⤴️ (+28%)
This prompt is respected as general instruction when using Rill with Claude Desktop using Rill MCP Server.
Conversational Analytics with Claude Desktop and Rill’s MCP
For example, here is Claude Desktop with Rill MCP connected, and the first thing it does is respect the AI instructions that guide the agents. This can also easily be improved and updated along the way:
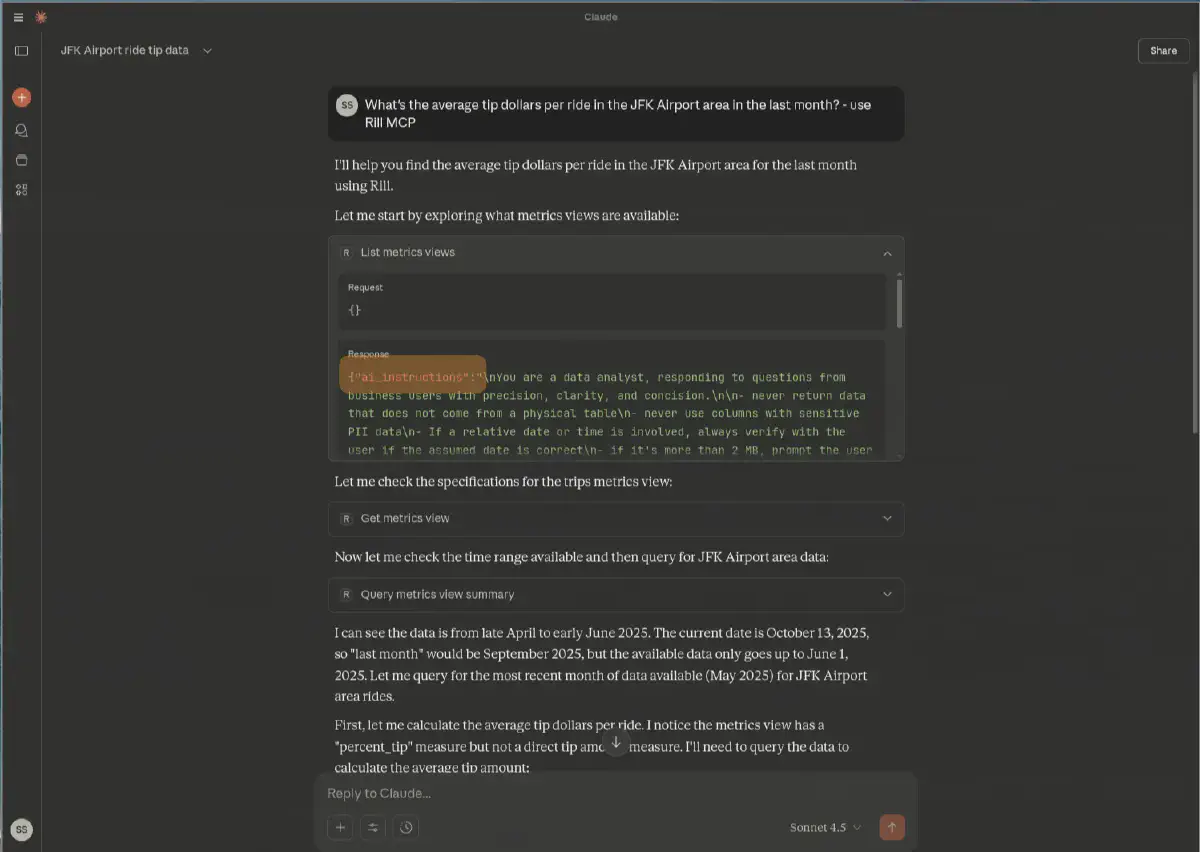
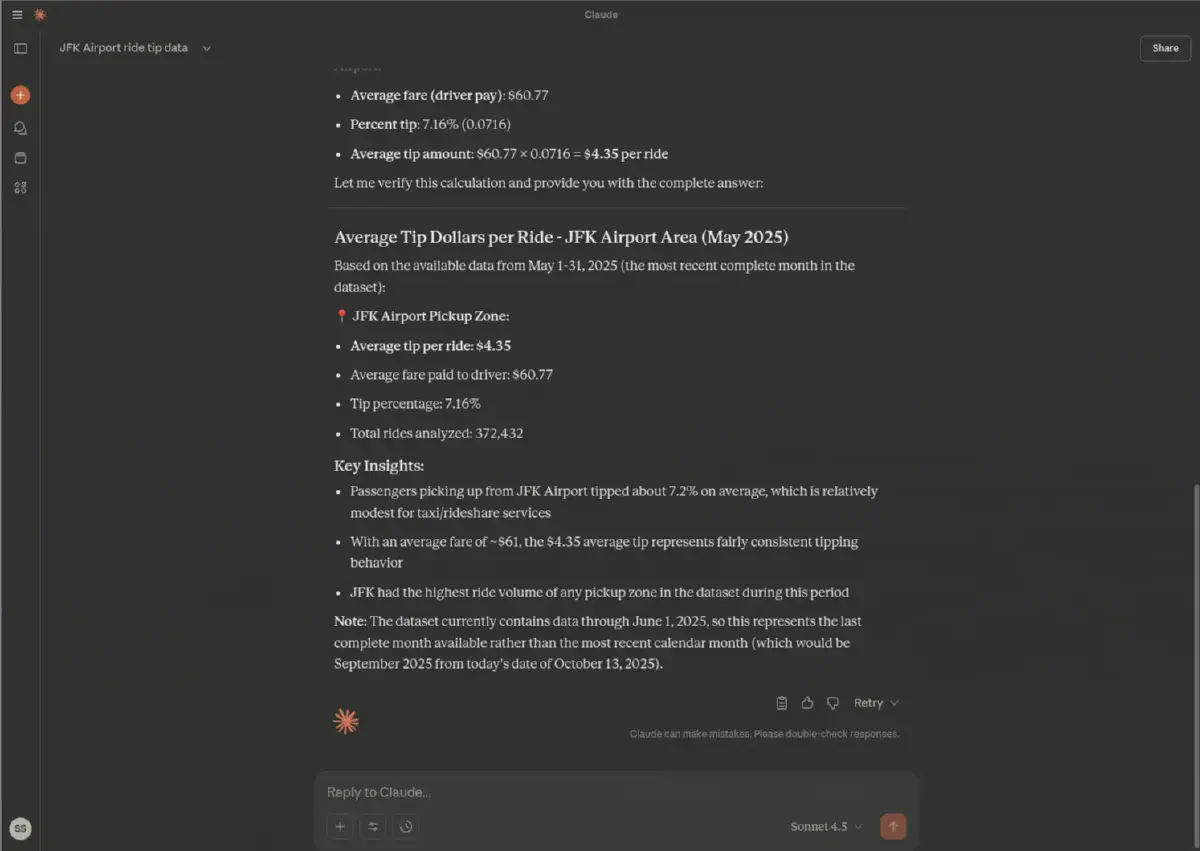
The great thing about Model Context Protocols is that they have an agentic workflow and work autonomously. As seen in the example below, they go back and forth on their own based on my initial prompt of What's the average tip dollars per ride in the JFK Airport area in the last month? - use Rill MCP. Notice I added to use MCP; this is not usually needed, but I just wanted to make sure.
After a couple of back-and-forths, autonomously but guarded by the ai_instructions and guardrails and by using the MCP connection to verify that its numbers and measures exist—e.g., here it found the dimension and the filter query (dropoff_zone LIKE '%JFK%') on its own, as well as discovering that there is no tip amount but rather a percentage:

The result of our prompt is based primarily on actual facts since we use MCP to verify everything, and is constrained and guided through the instructions provided.
This is a very powerful way of consuming analytics. But this can also be used to create new metrics or dashboards. For this, we’d use Claude Code instead of MCP, as the MCP does not allow creating new metrics at this point.
You can see an example with Cursor on my recent article on Understanding BI as part of BI-as-Code and the New Era of GenBI article.
Developing BI-as-Code with Claude Code
Just for demonstration purposes, we could also use Claude Code with Rill MCP, but it’s better to run directly on the local GitHub repo as it doesn’t have all the functionality or has problems with JSON conversion results.
But even more so because we have the CLI and access to the local Rill project, which has all the information and context, making it possible to add dashboards and new metrics on the fly, and to run commands through the CLI (rill --help for more information, or see the docs).
On top of that, Claude Code can also use Rill’s CLI to query itself, as well as the project definitions directly, as everything Rill provides is based on local files:
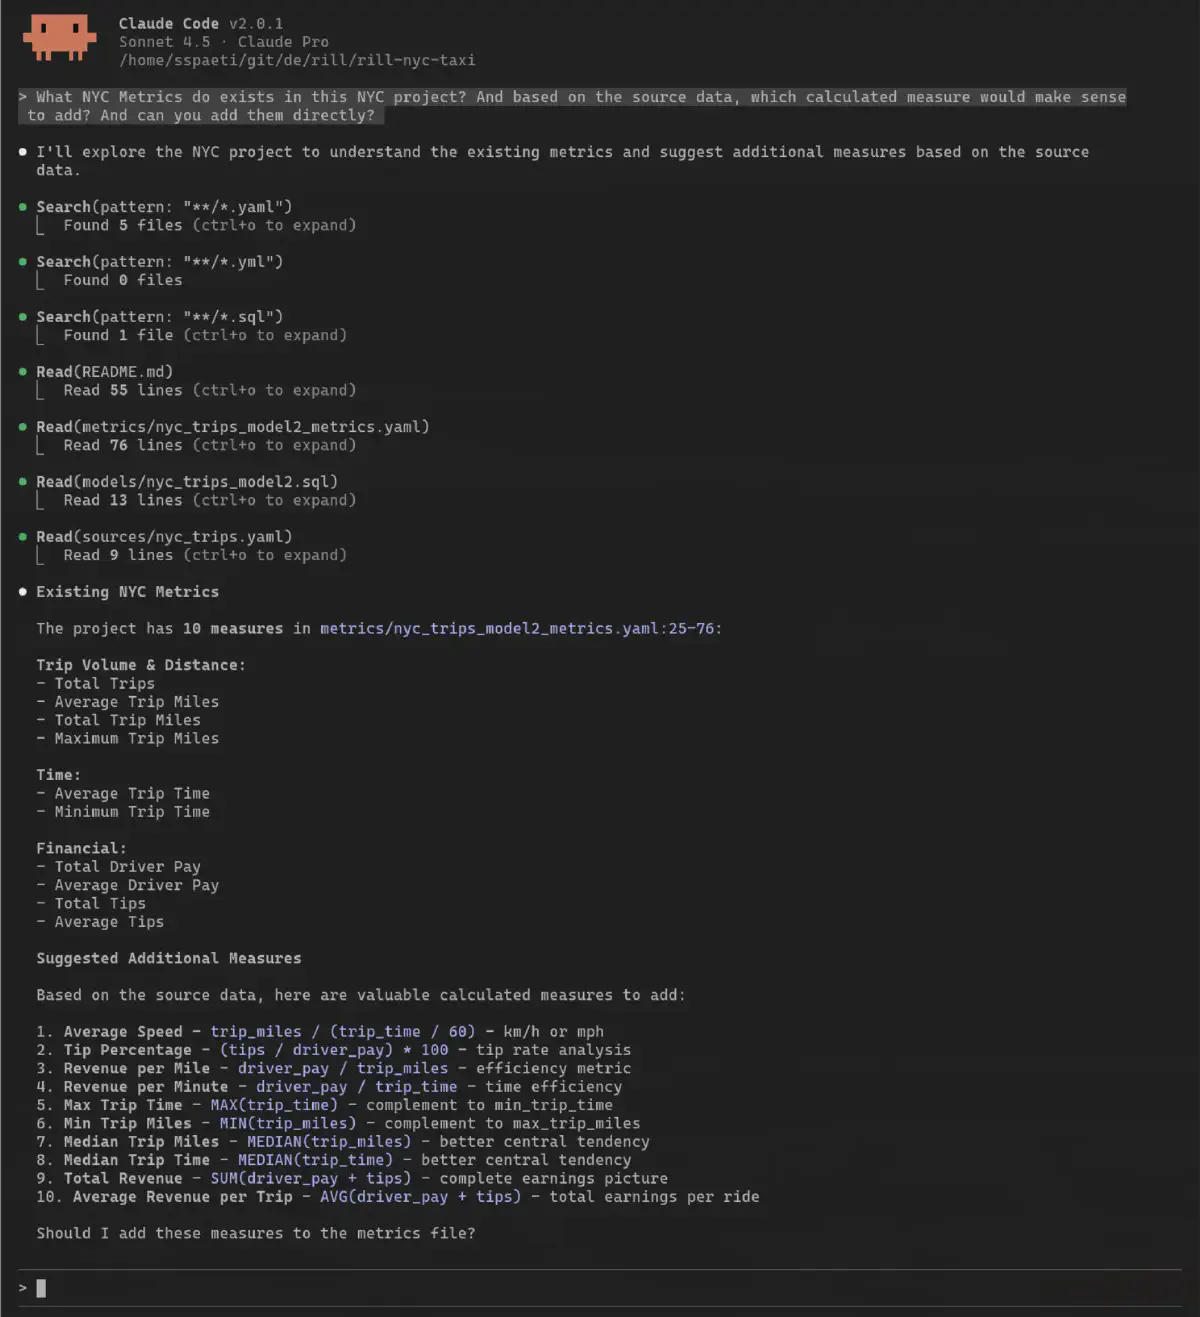
By choosing the metrics I want, it will go ahead and add them directly by:
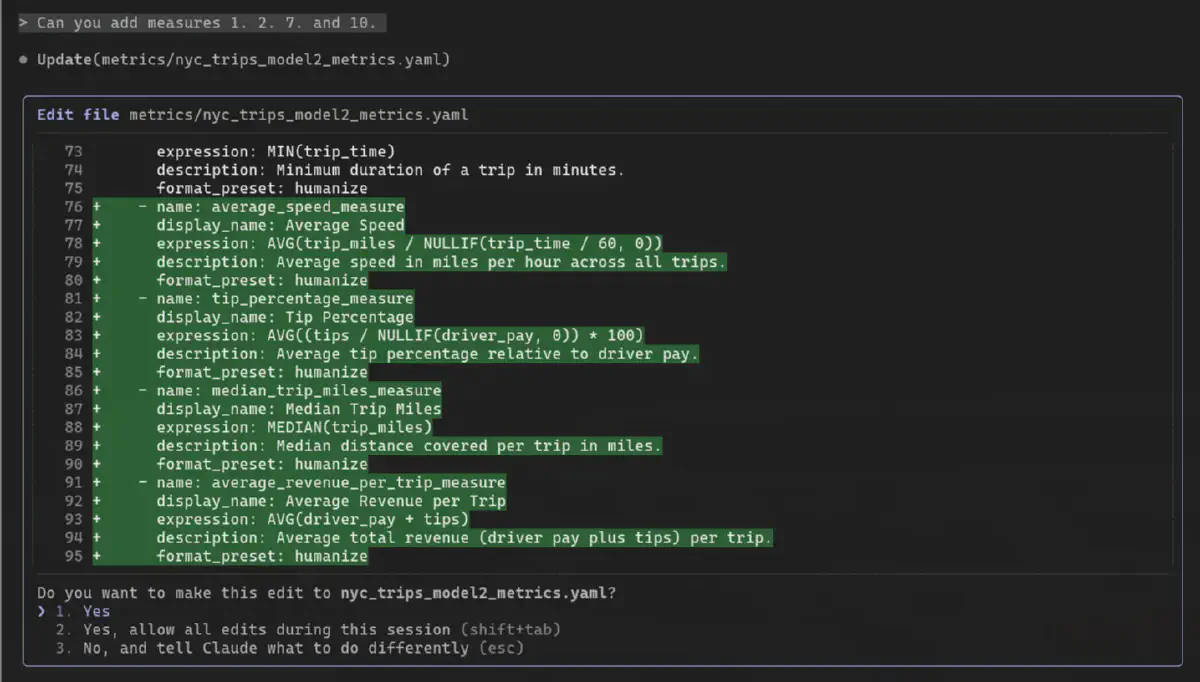
Let’s check if the dashboard still works:
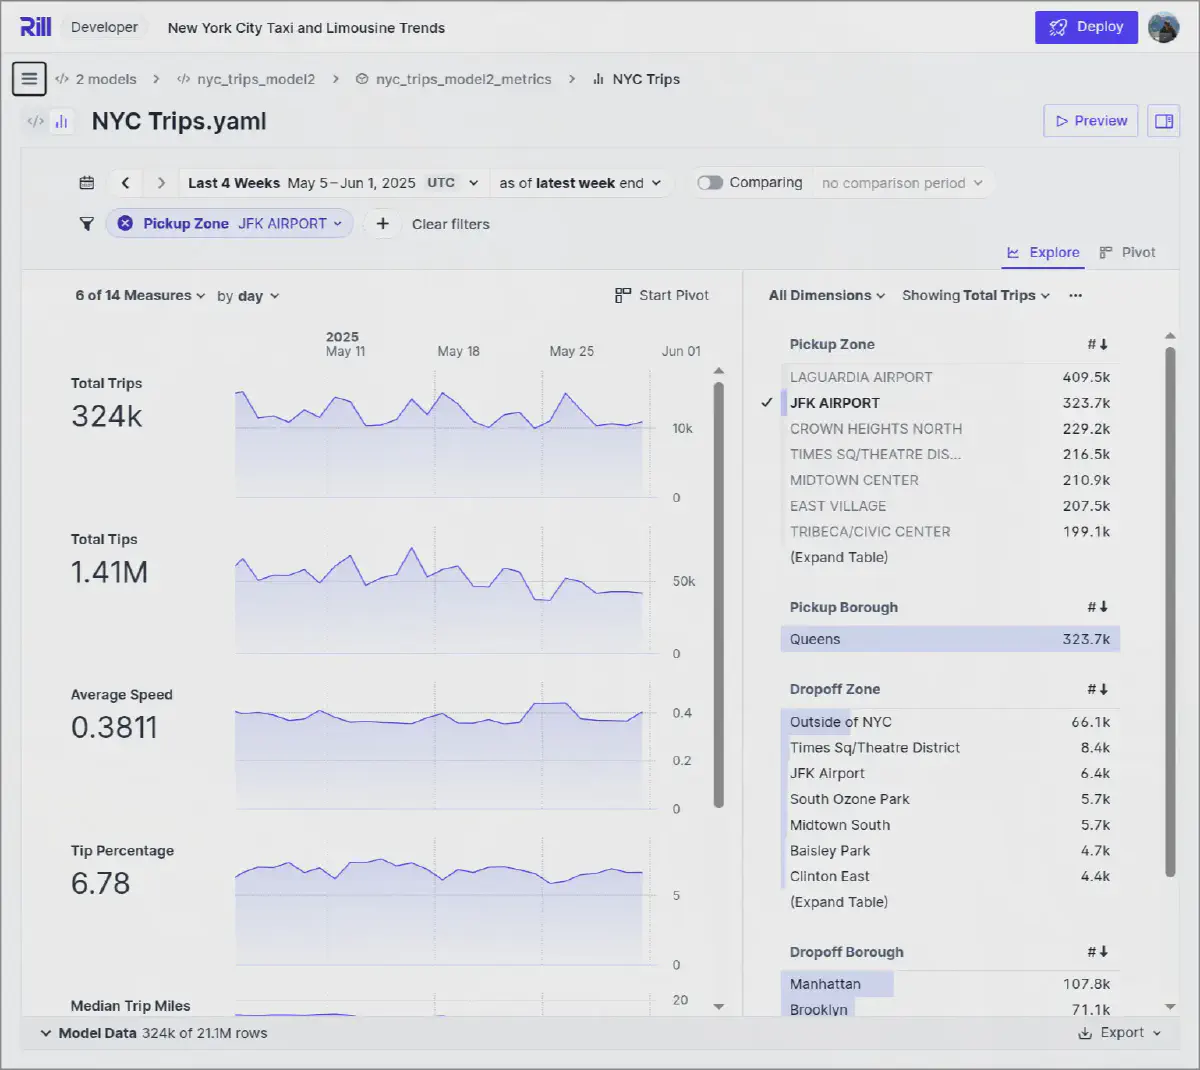
And it does, on the first try. This is also the power of a pre-existing structure and providing access to the agent. It can learn the expressions used, and with its SQL knowledge and context of the NYC Taxi dataset, it performs quite well.
Notice that I asked it to add missing metrics. With more domain knowledge, you could also tell the agent to add very specific metrics based on what you know and want to see.
Built-in Conversational Analytics
Or try the new feature of Rill with an AI agent built in—you can click here to jump to the NYC data set directly and play around with the AI Agent. Make sure to click that AI button on the top right.
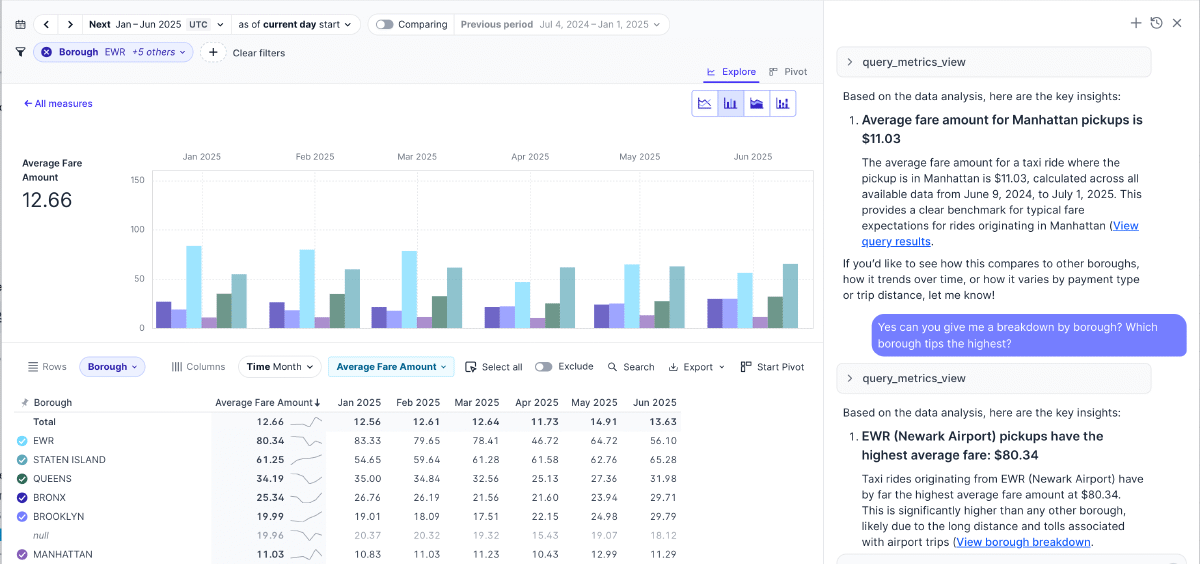
The best part is that it provides clickable links that open in Rill itself, along with on-the-fly breakdown views. I asked the agent What data do we have in this dataset? and it told me that we have 311 Calls Metrics with data such as noise complaints, street issues, etc. Therefore, I asked:
Can we see which borough has the highest noise complaints, then?
And it gave me the answers immediately, including three links (two only visible below) to click and explore my data in a pivot table:
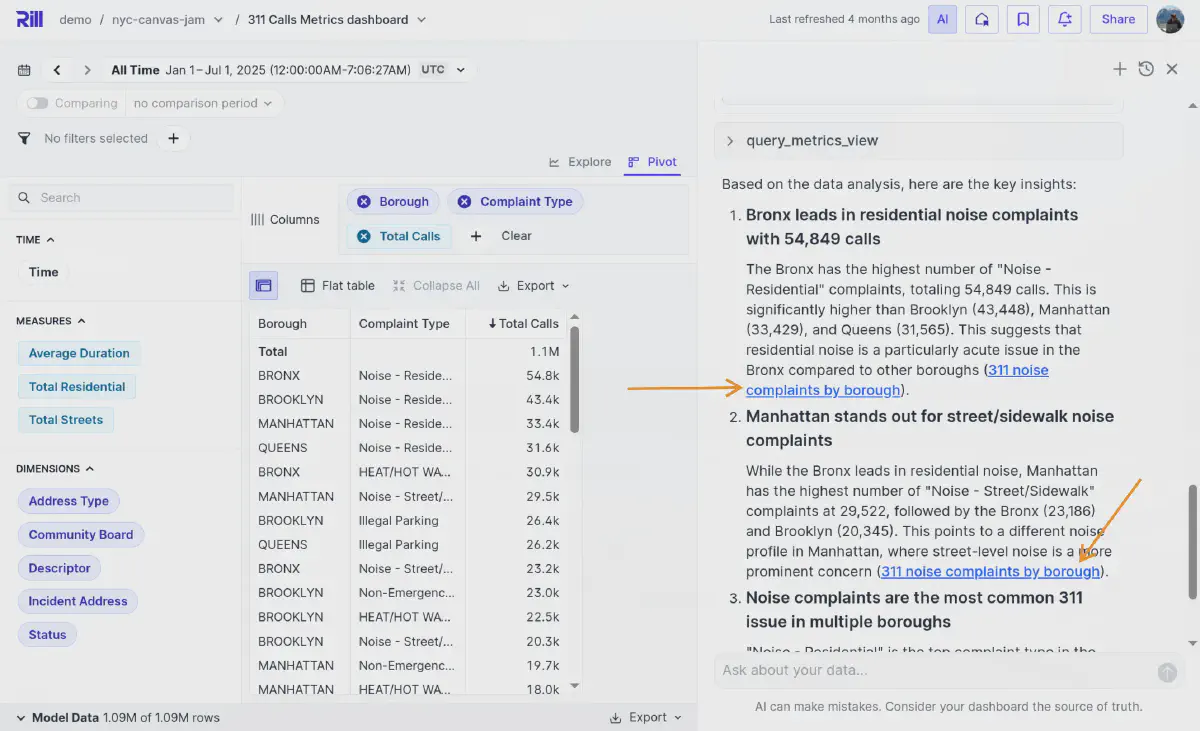
This showcases how Rill integrates an agent that uses built-in APIs to query metrics, verifies its numbers with actual queries, and even provides a pre-created pivot table to explore the data.
Combining Semantics, Speed, and Stewardship for Trusted Agent Workflows
Wrapping up this deep dive into agentic workflows with semantics, speed, and stewardship, we can say that modeling for agents has come a long way. But without constraints, guidelines, and even interactive testing of hypotheses, it’s risky to simply let it run.
But with instructions, fast iterative analytical databases, and good semantics, much is possible and will help create the requested metrics or insights much faster and with better quality, as collaboration with the agent can improve quality and deliver potentially new insights.
AI Linter for Data Modeling
To some extent, I see it as an AI-based linter, similar to what programmers use to lint their code.
For example, linting is defined as:
Lint is the computer science term for a static code analysis tool used to flag programming errors, bugs, stylistic errors and suspicious constructs. The term originates from a Unix utility that examined C language source code. A program which performs this function is also known as a “linter” or “linting tool”.
An agentic-powered workflow does just that. It lints our metric layer, helps us understand the context, and describes certain measures or data source models. But the above agent-based data modeling goes much further, as we’ve seen in the demo. Besides correcting and linting, it also helps in the creation phase of business intelligence.
It can’t understand all the details that someone who has worked with the data for a decade or has experienced the real-world behavior of the data would know. The linter should be a tool that is part of the workflow, assisting us as data modelers.
Agent-based data modeling doesn’t mean that AI is replacing humans anytime soon or autonomously doing everything itself. But like an advanced linter, it helps us with short-term productivity—such as fixing typos, identifying missing obvious columns, correcting syntax, and creating simple metrics. And the human driving the project is responsible for the long-term success, maintaining the control.
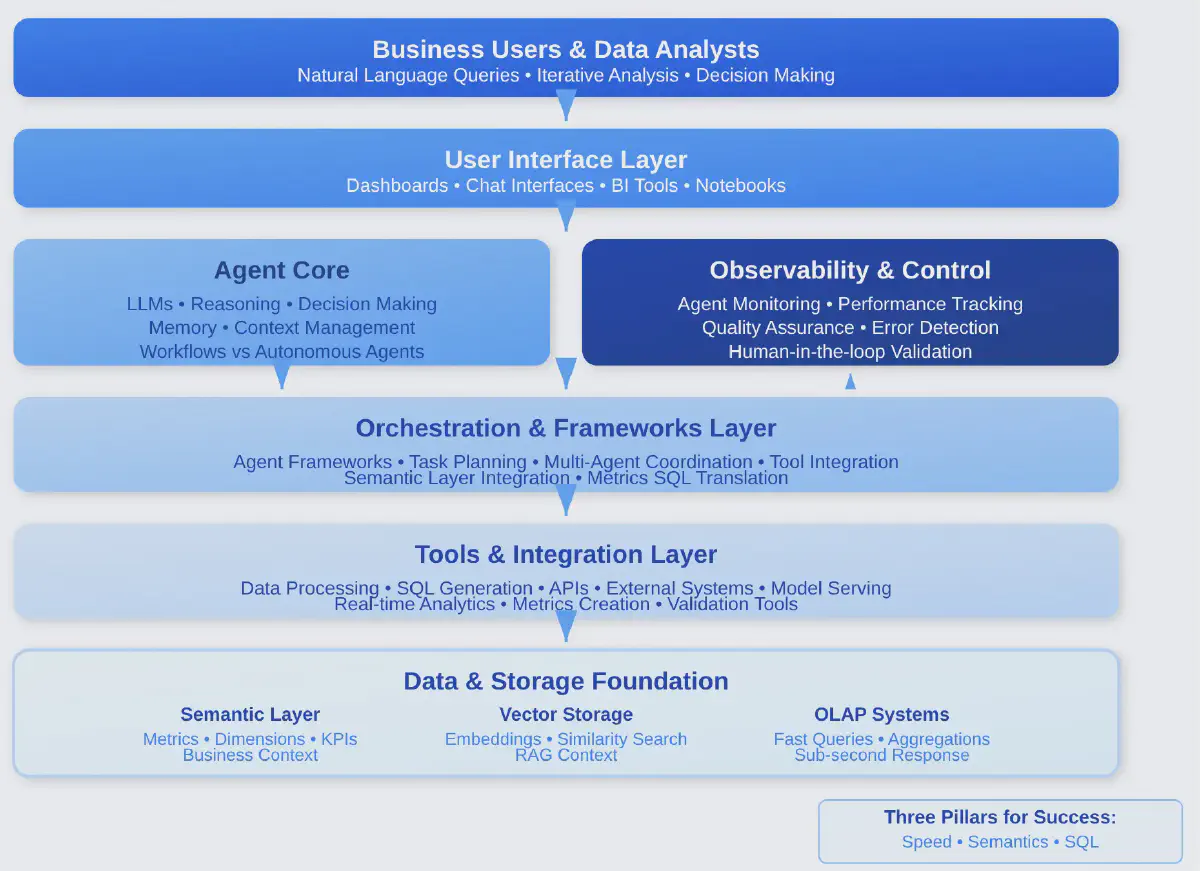
Current AI Agent Stack
The current AI-agent stack is very much in progress, but most often has multiple architectural layers, with storage and data forming the foundation. It includes vector databases for embedding storage and semantic search, hybrid databases that combine OLTP and OLAP capabilities, and traditional data warehouses for structured analytics.
Above this sits the AI model layer, containing large language models for reasoning, embedding models for vectorization, and the orchestration layer, which features frameworks for composing applications along with tools for data integration and transformation. With the MCPs connecting the agents with interfaces, we have a powerful architecture.
One big question is: how do we integrate with the Data Engineering Lifecycle rather than creating a separate data lifecycle on top of the existing one? Every step and layer we add works against the key pillar of speed. Having to wait for responses to load the vectors on top of reprocessing the latest data update might be one layer too many.
Optimize Agentic Workflow for Working with Data
Coming back to the initially discussed agentic-powered analytics with semantics through Metrics SQL, speed with real-time databases, and stewardship with guardrails and human oversight—these three pillars working together create a safe and effective workflow where agents work alongside us for data modeling, not replacing us but amplifying our capabilities. Recent research from the NBER study “How People Use ChatGPT” reveals that among 700 million weekly users, information-seeking and decision support dominate work usage, with about 81% of work-related messages focused on obtaining, documenting, and interpreting information. While data analysis represents only 0.4% of all messages, this creates an opportunity for making conversational analytics accessible to both technical and business users in ways that weren’t possible before.
A great agentic workflow is one that helps with your work but still lets you remain in the driver’s seat. Think of it as a BI pair programmer or an AI linter for business intelligence. It can lint your SQL or YAML metric definitions, format code, catch errors, and suggest improvements based on best practices. But just like a code linter, the final decision rests with you. The ai_instructions we discussed act as high-level guidelines and rules. Combined with fast analytics that enable immediate verification and a semantic layer that provides clear definitions, you get an agentic workflow that’s both powerful and safe. This is stewardship in action.
As we’ve learned throughout this article, data modeling fundamentals haven’t changed over the years. Modeling remains the key to success for data projects, especially in the long run. What has changed is that we now have powerful agent collaborators that can assist with modeling.
The traditional analytics workflow has been primarily about consumption—viewing dashboards and reading reports—but with agentic workflows, we’re shifting toward a hybrid of consumption and creation. Every agent interaction becomes a potential user of your data platform, and just as you design for human users, you now must design your metrics layer with both human and agentic users in mind.
Build your data stack with semantics, speed, and stewardship in mind, and you’ll be ready for the conversational, agentic analytics of tomorrow. Metrics SQL provides the structured language agents can work with reliably, real-time databases like DuckDB and ClickHouse enable the rapid iteration necessary for validation, and proper guardrails ensure quality without hindering innovation.
.jpg)
.svg)


Ready for faster dashboards?
Try for free today.