
.jpg)
dlt+ClickHouse+Rill: Multi-Cloud Cost Analytics, Cloud-Ready


Following up on Part 1, where we created an entire end-to-end FinOps project to analyze cloud costs from different hyperscalers with dlt and local parquet files. In this part 2, we set up a version that works cloud-native with ClickHouse Cloud and Rill Cloud. So you can share your dashboard and it scales to any cost data you might have.
The work is done through a GitHub action job for illustration purposes. This can be updated or also run as an orchestration job or anywhere else. This job now runs every day and extracts data from my AWS and GCP, plus Stripe data, and then adds some randomization for demo purposes and anonymizes my actual cost data.
So in this article we dig into how we achieved that, what the hardest parts were, and how you can reuse this project.
Essentially, we built Logs -> S3 -> GitHub Actions -> ClickHouse -> Rill UI with a simple open source data project. You can use the code to run locally, or with the latest version with ClickHouse and Rill Cloud.
Jump directly to the Code on GitHub
Get started with cost reports and use the template at cloud-cost-analyzer. It’s a scaffold for your FinOps immediately with dlt, ClickHouse, GitHub Actions and Rill metrics and dashboards. As usual, easily extendable with common and local declarative configurations through YAML, Python and SQL. Continue reading for more information. PS: Find the first local version at branch v1.
Why This Matters: FinOps
Have you heard about FinOps? FinOps is a discipline that combines financial management principles with cloud engineering and operations, providing organizations with a better understanding of their cloud spending.
The goal of FinOps is to maximize revenue or business value through the cloud. It isn’t to save money per se, but it certainly helps with that too. FinOps should enable the organization to control the cloud’s spending and have an overview of costs.
With this hands-on project you basically have a template you can use that works out of the box with tested and proven software, and you can extend modularly with dlt and easily extend more reports and dashboards with Rill, a powerful BI tool that includes an even more powerful modeling and Metrics Layer.
Is FinOps just BI?
In a sense, FinOps is a dedicated business intelligence application with a dedication to cost overview and finances, paired with operation and monitoring.
How to Extend Existing dlt + Parquet + Rill to ClickHouse + Cloud
Let’s dive into the code and how we built this. We had three steps to complete: first to ingest data into ClickHouse, then visualize and deploy the dashboards and canvas to Rill Cloud, and automate the whole process with GitHub actions.
As we purposely stored extracted data as local Parquet files in Part 1, we can now ingest this directly to ClickHouse Cloud.
After you signed up for ClickHouse Cloud (there’s a 30-day free trial) and created a service on either GCP, AWS, or Azure, you have different options to ingest the data.
You could use their cloud ETL version called Clickpipes, that works great for massive data and working with a few buttons. But as I am an engineer, and I wanted a declarative-first data stack, a code-first approach that you can easily reuse, I chose the other handy option that ClickHouse offers with “Connect”.
With connect you have different options:
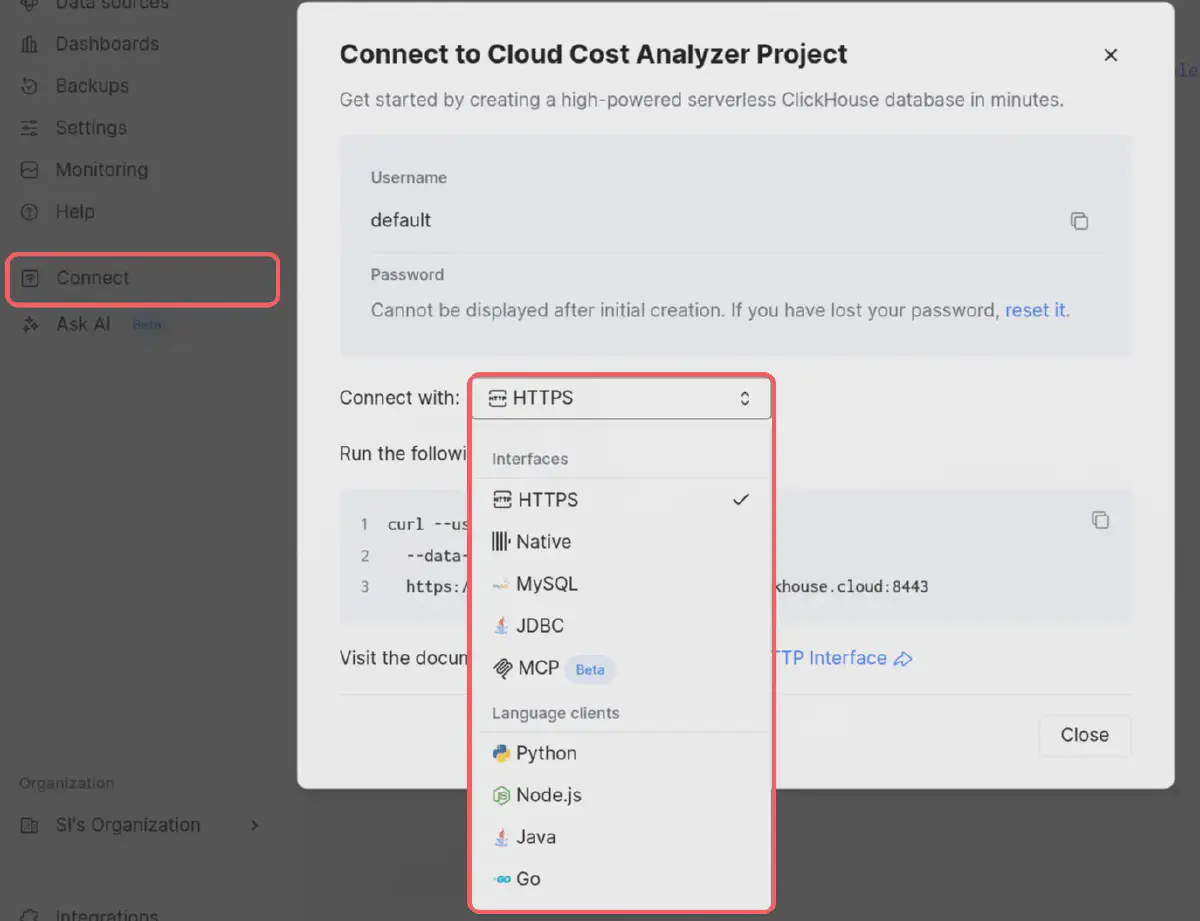
As we use dlt in this project with Python, I chose that option. ClickHouse provides you with all the instructions:
pip install clickhouse-connect
and
import clickhouse_connect

if __name__ == '__main__':
    client = clickhouse_connect.get_client(
        host='<YOUR-HOST>.europe-west4.gcp.clickhouse.cloud',
        user='default',
        password='<PASSWORD>',
        secure=True
    )
    print("Result:", client.query("SELECT 1").result_set[0][0])
The user and password are seen above (default is default) and you generate the password. After you generated the password, store it for the ENV variable and it should look like this:

Add all the ENV variables to the .dlt/secrets.toml (see secrets.toml.example for an example):
[destination.clickhouse.credentials]
host = "xxxxx.europe-west4.gcp.clickhouse.cloud"
username = "default"
password = "<your-clickhouse-password>"
secure = 1
After that, we can connect to ClickHouse via Python. I created an init_clickhouse.py script to initialize dlt-needed tables and users based on their recommendations. If you run make init-clickhouse it should now successfully connect to ClickHouse Cloud server and create users and tables.
If you haven’t already, run make install (or uv sync) to get the clickhouse-connect and other packages installed.
Ingestion from AWS CUR, GCP Cost and Stripe
For the dlt ingestion run, I added the DLT_DESTINATION ENV variable that we can set to clickhouse, so we can run the same dlt pipelines without needing to change anything.
So instead of running dlt for a local run with, for example, AWS CUR:
uv run python pipelines/aws_pipeline.py
We can now run:
DLT_DESTINATION=clickhouse uv run python pipelines/aws_pipeline.py
And this will ingest the generated parquet files to ClickHouse Cloud. This also works with GCP and Stripe. Run make run-etl-clickhouse to run all three.
What this ENV is doing is setting the dlt destination to clickhouse as opposed to filesystem as default:
    pipeline = dlt.pipeline(
        pipeline_name=pipeline_name,
        destination=destination,
        dataset_name=dataset_name,
    )
Find the full script aws_pipeline.py or the other pipelines in the same pipelines folder.
That’s it. That was the whole magic. Thanks to dlt, this is a piece of cake. If you ran the above run-etl-clickhouse you should see all data in ClickHouse Cloud, which should look something like this:
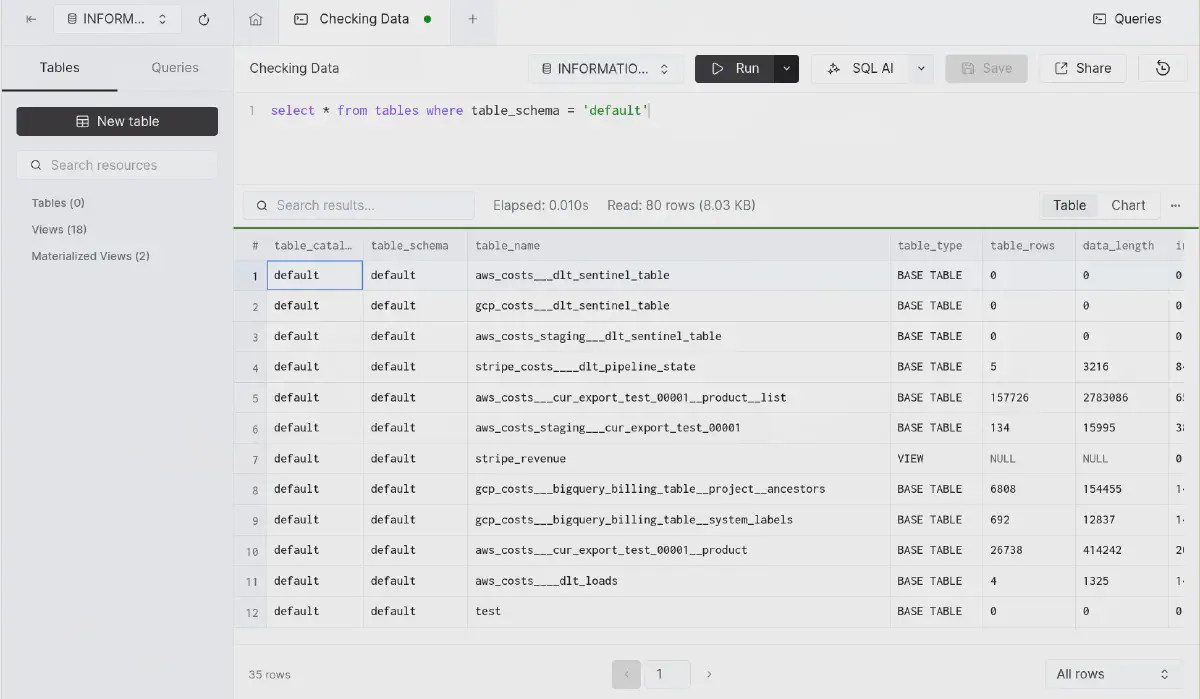
Ingested data into ClickHouse Cloud, verified through INFORMATION_SCHEMA. Notice ClickHouse shows table_rows and data_length, which is not typically part of this schema, but super handy to verify our data.
Deploy to Rill Cloud
The next step is to deploy to Rill Cloud. Please make sure you have a Rill Trial account. For this we need two steps: first a deploy command and then to change the connectors from local DuckDB connector to ClickHouse.
For deployment we can deploy our project with:
rill deploy \
--org YOUR_ORGANZATION_NAME \
--path viz_rill \
--prod-branch main \
I did that to the public demo org, click on the link and you’ll see below dashboard and canva:
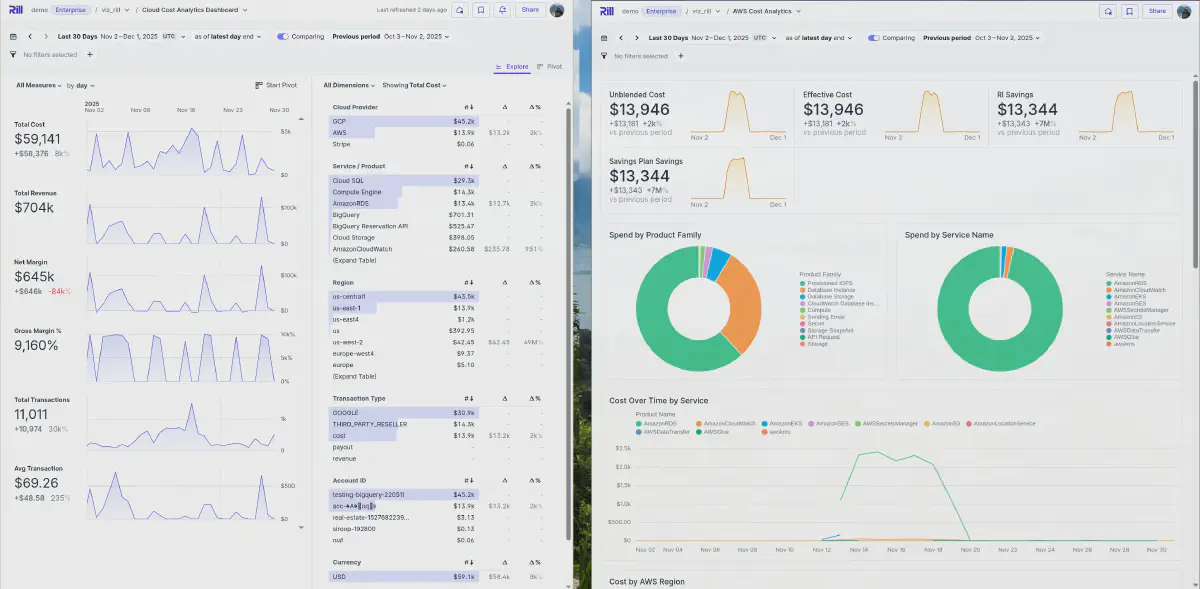
Or navigate directly to some of the created dashboards with these links: AWS Cost Overview Canva, GCP Product Deep Dive, Cloud Cost Analytics Dashboard, or AWS Cost Explore. Feel free to choose others in the navigation as well.
Run Locally but Connected to ClickHouse Cloud
If you want to run Rill locally, but connected to Rill Cloud, you can setup CONNECTOR_CLICKHOUSE_DSN in viz_rill/.env with the right connection string: CONNECTOR_CLICKHOUSE_DSN=clickhouse://default:your-password@xxxxx.europe-west4.gcp.clickhouse.cloud:8443/default?secure=true (See the example .env.example for more information).
And secondly change RILL_CONNECTOR and olap_connector configuration to the value clickhouse (it should be duckdb if you were running locally). There’s a make command that you can run to do that with make setup-connector-clickhouse which will do it automatically for you.
This is what it does behind the curtains:
setup-connector-clickhouse:
	@sed -i 's/^olap_connector:.*$$/olap_connector: clickhouse/' viz_rill/rill.yaml
	@sed -i 's/^RILL_CONNECTOR=.*$$/RILL_CONNECTOR="clickhouse"/' viz_rill/.env
With make serve or rill start, it will now connect to ClickHouse cloud and serve you the data locally in the fast, interactive and convenient Rill way you are used to.
ClickHouse.md
Find more technical details regarding ClickHouse under CLICKHOUSE.md.
GitHub Actions
That’s it. We have successfully moved our local FinOps project to the cloud. Now we only need to automate the pipeline run and execute it daily to get the latest cost updates from AWS, GCP and Stripe (and any potential additions you make).
This was mostly a simple Claude Code task, specifying the .dlt/secrets.toml we need and that we want to execute the make commands. With that, it had all the information needed to create the GitHub action for Cloud Cost ETL Pipeline. Find the .workflow setup at etl-pipeline.yml.
Clear ClickHouse Tables
I created another pipeline Clear ClickHouse Data that lets us delete the data on ClickHouse if we want to start over. See YAML Setup.
What Was the Hardest Part?
When building these projects, and as mentioned in Part 1, we always think they are quick and easy. So to learn from my pain and obstacles, I’ll share the hardest parts of this upgrade to ClickHouse (for the initial creation, see Part 1).
Someone asked me:
Curious what was the hardest part of the demo?
I’d say there are multiple things, but what was a piece of cake was the ingestion switch from local to ClickHouse due to dlt, and the ease of documentation of ClickHouse Cloud product with connect examples. Also straightforward was the Rill switch, to change the connector to ClickHouse. A little harder was the interactive switch between the two. A little more on that below.
Interactive Switch Visualizing Data Locally to ClickHouse
To switch from local to any other source is straightforward. You change the rill.yaml from duckdb to olap_connector: clickhouse and then add a connector clickhouse.yaml that points to an ENV with the credentials:
type: connector
mode: readwrite

driver: clickhouse
dsn: "{{ .env.CONNECTOR_CLICKHOUSE_DSN }}"
A little harder was to switch between that and DuckDB to read the local parquet. Because parquet needs the read_parquet() function of DuckDB, we have different queries for both connections (on ClickHouse we have plain tables). Luckily Rill provides us with a handy templating convention that we can apply in the models, for example here aws_costs.sql model where we read the ENV we set to dynamically switch:
{{ if .env.RILL_CONNECTOR }}
-- ClickHouse: Query table directly
SELECT
  toDate(splitByChar('T', identity_time_interval)[1]) AS date,
  COALESCE(product_servicecode, line_item_product_code, 'Unknown') AS product_product_name,
  product_servicecode AS product_servicename,
  *
FROM aws_costs___cur_export_test_00001
WHERE identity_time_interval IS NOT NULL

{{ else }}
-- DuckDB: Read from parquet files (default for local development)
SELECT

  CAST(SPLIT_PART(identity_time_interval, 'T', 1) AS DATE) AS date,
  COALESCE(product_servicecode, line_item_product_code, 'Unknown') AS product_product_name,
  product_servicecode AS product_servicename,
  *
FROM read_parquet('data/aws_costs/cur_export_test_00001/*.parquet')
WHERE identity_time_interval IS NOT NULL

{{ end }}
Also notice the date functions are not identical. This is another never-ending struggle in data engineering and BI in general. The SQL dialects are not aligned, and every database has a little different flavour of date and other functions.
With this Model Environment Templating feature, we can work around this practically. We could also set env variables such as dev, test and prod for example. See the linked docs above.
Hard-coded Table Names and Reports
Another never-ending struggle, that is quite common too, is the naming of tables and hard-coding these.
I learned again that names you set on reports matter, as they will be propagated down to the table and need to align in your scripts. You start initially testing and creating a report for cost, but then end up having to use that name as table names.
I tried to put all names into ENV variables wherever possible (see .dlt/config.toml), so it’s easy for you to change. But this is not always possible, or in the developing phase, it can happen that you hard-code a table name or a path here and there. If I have forgotten that, you’ll notice immediately on first run.
But this is a normal setup process of data engineering projects and they get more configured and automated over time. In the first version, you are happy it works, then you start optimizing speed, then security and ultimately you share it with others to make it reusable.
So in that process a lot of ENV variable setup is needed, properly configured for command line scripts like Python pipelines and even Rill that need to use the same.
This coordination is not always easy. As seen in my Makefile, you see that some things like Rill Connectors have been done with sed and search replacement. As we have a declarative data stack and all configuration in this project, it’s much easier to automate these things, compared to if they were configured and locked away in a Cloud UI somewhere.
That’s one advantage that makes this project so powerful. With Rill and dlt, we have everything locally in the repo, in our control to automate and configure from one place.
Data Anonymization
Most of the time, anonymization or randomization is also a part. I used it to firstly make my data a little more interesting (as I used my personal cost data and I don’t have a lot), and second, so it won’t show in the future every detail I buy, although it’s not too much of a secret.
I used Claude Code to generate and anonymize my data. See anonymize_clickhouse.py python script, or ANONYMIZATION.md for documentation of it.
This is only done for my ClickHouse upload to showcase the dashboard on Rill cloud. If you run it for yourself, either locally where anonymization is not run, or in ClickHouse, you just don’t run the above script (remove make anonymize-clickhouse).
Anonymization would be worth a full article, as at enterprise scale you always have the need to copy production data to dev but are not allowed to show PII or other critical data to everyone that has access to the development environment.
That’s why you need some kind of anonymization process, or you test with fake data.
Bringing Everything Together
Setting up all credentials, bringing the extraction and ingestion, the data modeling part where we join source tables potentially to fact and dimensions, and then make it work with dashboards and reports, is always the hardest part.
There are lots of glue code required. These days we can use AI helpers, but at the end of the day, we are the architects. We need to know how the data should flow, what systems we have, and what’s the fastest and best way to export and import certain data. Once we have that figured out, Claude Code and others can help us a ton.
But also, typically they make the project much larger. They tend to add code instead of refactoring as they are afraid to break existing code. Also the bigger the project gets, the harder it is to get the context of every detail for the agents, and they need good guidance from us.
Therefore we need to be careful not to let things grow too big. One danger you can also see in the documentation of this project, where Claude always added new Markdown files for each new step, instead of having a succinct Readme for everything.
Summary
So what did we learn? A lot. But hopefully the project helps you to get started with your FinOps, extracting and having an overview of your own hypercloud costs, potentially merging it with revenue and CRM sources, so you have a great first step to have a BI cockpit for all your cost data with low effort and low cost.
Built with the Declarative Data Stack in mind, that is easy to configure and extendable via dlt and other models and metrics views in Rill.
Let me know what you think, and how you are building FinOps overviews for your company. Again the full project can be found under GitHub - Cloud Cost Analyzer.
.jpg)
.svg)


Ready for faster dashboards?
Try for free today.